Upcoming Ex-Dividend Dates for Spectrum Brands Holdings, Carter's, and PHINIA
Upcoming Ex-Dividend Dates: On 11/24/25, Spectrum Brands Holdings Inc (SPB), Carter's Inc (CRI), and PHINIA Inc (PHIN) will trade ex-dividend, with respective dividends of $0.47, $0.25, and $0.27 scheduled for payment on 12/9/25, 12/5/25, and 12/12/25.
Expected Price Adjustments: Following the ex-dividend date, SPB shares are expected to open 0.86% lower, CRI by 0.87%, and PHIN by 0.51%, based on their recent stock prices.
Dividend Yield Estimates: The estimated annualized yields for the companies are 3.44% for Spectrum Brands, 3.50% for Carter's, and 2.04% for PHINIA, reflecting their historical dividend stability.
Current Trading Performance: As of Thursday trading, shares of Spectrum Brands, Carter's, and PHINIA are up approximately 0.6%, 0.2%, and 0.7%, respectively.
Trade with 70% Backtested Accuracy
Analyst Views on CRI
About CRI
About the author

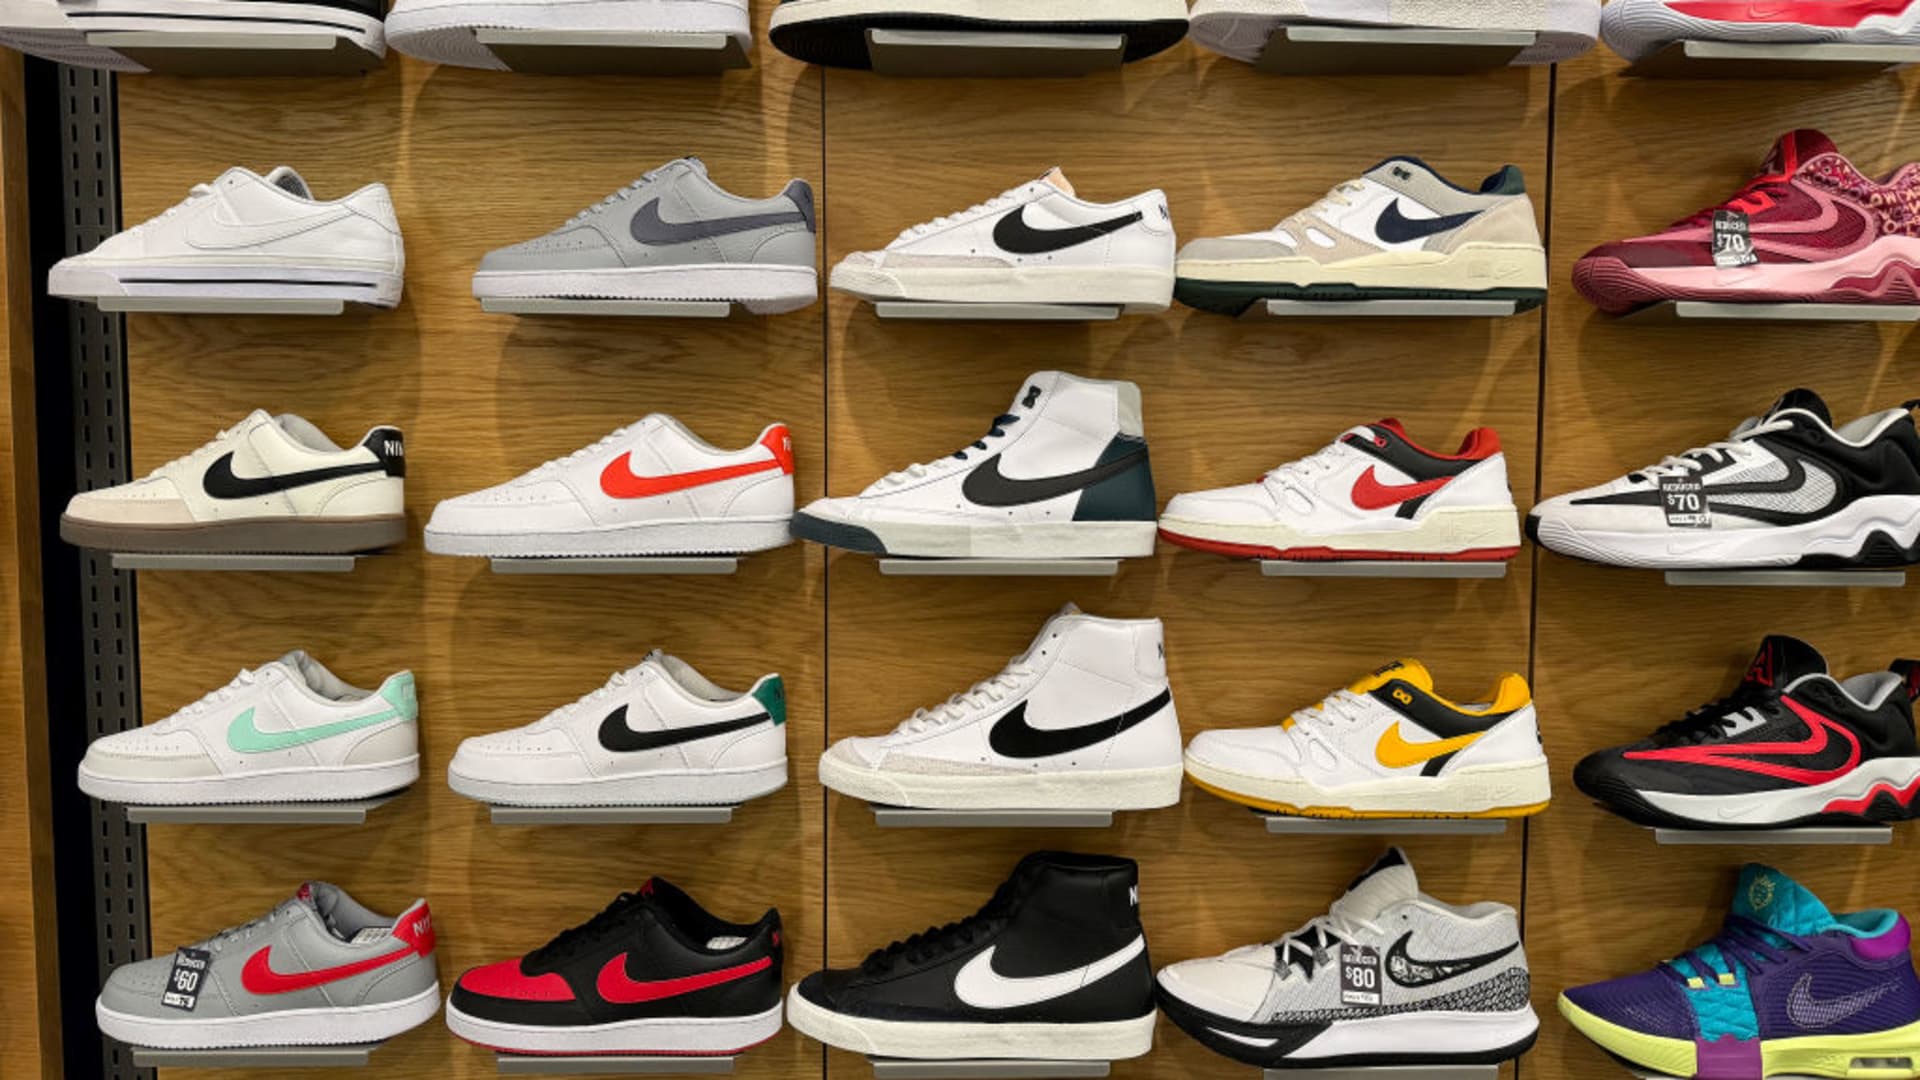
Opportunities and Challenges in the Footwear and Apparel Industry
- Premiumization Trend: The footwear and apparel industry is benefiting from consumers' preference for high-performance, high-quality products, which is driving price increases and enhancing brand loyalty, likely strengthening market competitiveness further.
- Digital Transformation: Brands are increasingly investing in e-commerce platforms and data analytics, improving customer relationships and inventory efficiency, which promotes growth in direct-to-consumer sales and enhances market responsiveness.
- Margin Pressure: Despite the overall optimistic outlook for the industry, frequent promotional activities, excess inventory, and cautious consumer spending are compressing profit margins, posing challenges to profitability.
- Industry Ranking: The Zacks Shoes and Retail Apparel industry ranks 89, placing it in the top 37%, indicating the sector's potential for future earnings growth, even though its overall performance has been poor over the past year.
Carter's Q4 2025 Earnings Call Insights
- Revenue Growth Resurgence: Carter's reported Q4 2025 net sales of $925 million, an 8% increase year-over-year, and a 3% rise in consolidated net sales excluding the 53rd week, marking the first year-over-year growth since 2021, indicating successful brand and consumer strategies.
- Margin Challenges: Despite revenue growth, gross margin fell to 43.2%, down 460 basis points year-over-year, primarily due to a $40 million tariff impact, reflecting pressure on the company's cost control and pricing power, which may affect future profitability.
- Cautious Future Outlook: Management expects net sales growth in the low to mid-single digits for 2026, while adjusted earnings per share are projected to decline in the low double digits to mid-teens, indicating a cautious stance on future profitability amid tariff and inflation challenges.
- Management Changes: Carter's announced the retirement of Treasurer Sean McHugh and appointed T.C. Robillard as the new Vice President of Investor Relations, signaling strategic adjustments at the executive level to address future challenges.

Carter's Guidance Overshadows Q4 Earnings, Shares Plunge
- Strong Sales Growth: Carter's reported a 7.6% year-over-year increase in Q4 sales to $925.5 million, although the actual growth was only 3.4% due to an extra week, indicating growth across U.S. retail, international, and wholesale segments, yet the market reacted negatively due to poor future guidance.
- Operating Income Slightly Up: Operating income rose 1.8% to $84.7 million, but the operating margin fell by 50 basis points to 9.2% due to increased tariffs, product investments, and incentive compensation, highlighting the cost pressures impacting profitability.
- Adjusted EPS Decline: Carter's adjusted EPS fell by 20.5% to $1.90, reflecting significant pressure on profitability in a high-cost environment, which exacerbated market pessimism regarding future earnings expectations.
- Future Guidance Below Expectations: The company guided for mid-single-digit net sales growth in Q1, but EPS guidance of $0.02 to $0.08 is well below the consensus of $0.36, leading to a 12.3% drop in shares during premarket trading.
Carters Inc. Reports Increased Q4 Earnings
- Earnings Growth: Carters Inc. reported a fourth-quarter profit of $64.22 million, translating to $1.76 per share, which is an increase from last year's $61.52 million and $1.71 per share, indicating sustained improvement in profitability.
- Adjusted Earnings: Excluding items, the company reported adjusted earnings of $69.2 million or $1.90 per share, reflecting strong performance in its core business and enhanced profitability.
- Revenue Increase: The company's revenue rose 7.6% year-over-year to $925.45 million, up from $859.71 million last year, demonstrating increased market demand and effective sales strategies.
- Market Impact: The growth in earnings and revenue not only boosts investor confidence but also lays the groundwork for future business expansion and market share enhancement, strengthening Carters Inc.'s competitive position in the children's apparel market.
Carter's Q4 Earnings Beat Estimates but Disappointing Outlook
- Earnings Beat: Carter's reported adjusted EPS of $1.90 for Q4, surpassing analyst expectations of $1.56, yet shares fell 5.3% due to disappointing fiscal 2026 guidance.
- Significant Revenue Growth: The company achieved $925 million in revenue for the quarter, an 8% increase from $860 million year-over-year, exceeding the consensus estimate of $903.84 million, with an extra week contributing approximately $37 million in sales.
- Disappointing Outlook: Carter's projects a low double-digit to mid-teens decline in adjusted diluted EPS for fiscal 2026 from $3.47 in fiscal 2025, with Q1 EPS expected to be only $0.02 to $0.08, significantly below last year's $0.66.
- Dividend Declaration: The Board declared a quarterly dividend of $0.25 per share, payable on March 27, 2026, while still aiming for low single-digit to mid-single-digit growth in net sales and adjusted operating income despite tariff cost pressures.

Market Sentiment Shifts to Fear Zone
- Market Sentiment Decline: The CNN Money Fear & Greed Index fell from 45.8 to 44.4, indicating a shift to the fear zone, which may weaken investor confidence and negatively impact stock performance.
- Jobless Claims Rise: Initial jobless claims in the U.S. increased by 4,000 to 212,000, close to the market estimate of 215,000, reflecting potential softness in the labor market that could adversely affect consumer spending.
- Major Index Performance: The Dow Jones rose by about 17 points to 49,499.20, while the S&P 500 fell 0.54% to 6,908.86, and the Nasdaq Composite dipped 1.18% to 22,878.38, indicating overall market pressure.
- Sector Performance Divergence: While most sectors closed lower, with consumer discretionary, information technology, and communication services suffering the largest losses, industrials and financial stocks bucked the trend, suggesting some resilience within the market.
Opportunities and Challenges in the Footwear and Apparel Industry
- Premiumization Trend: The footwear and apparel industry is benefiting from consumers' preference for high-performance, high-quality products, which is driving price increases and enhancing brand loyalty, likely strengthening market competitiveness further.
- Digital Transformation: Brands are increasingly investing in e-commerce platforms and data analytics, improving customer relationships and inventory efficiency, which promotes growth in direct-to-consumer sales and enhances market responsiveness.
- Margin Pressure: Despite the overall optimistic outlook for the industry, frequent promotional activities, excess inventory, and cautious consumer spending are compressing profit margins, posing challenges to profitability.
- Industry Ranking: The Zacks Shoes and Retail Apparel industry ranks 89, placing it in the top 37%, indicating the sector's potential for future earnings growth, even though its overall performance has been poor over the past year.
Carter's Q4 2025 Earnings Call Insights
- Revenue Growth Resurgence: Carter's reported Q4 2025 net sales of $925 million, an 8% increase year-over-year, and a 3% rise in consolidated net sales excluding the 53rd week, marking the first year-over-year growth since 2021, indicating successful brand and consumer strategies.
- Margin Challenges: Despite revenue growth, gross margin fell to 43.2%, down 460 basis points year-over-year, primarily due to a $40 million tariff impact, reflecting pressure on the company's cost control and pricing power, which may affect future profitability.
- Cautious Future Outlook: Management expects net sales growth in the low to mid-single digits for 2026, while adjusted earnings per share are projected to decline in the low double digits to mid-teens, indicating a cautious stance on future profitability amid tariff and inflation challenges.
- Management Changes: Carter's announced the retirement of Treasurer Sean McHugh and appointed T.C. Robillard as the new Vice President of Investor Relations, signaling strategic adjustments at the executive level to address future challenges.
Carter's Guidance Overshadows Q4 Earnings, Shares Plunge
- Strong Sales Growth: Carter's reported a 7.6% year-over-year increase in Q4 sales to $925.5 million, although the actual growth was only 3.4% due to an extra week, indicating growth across U.S. retail, international, and wholesale segments, yet the market reacted negatively due to poor future guidance.
- Operating Income Slightly Up: Operating income rose 1.8% to $84.7 million, but the operating margin fell by 50 basis points to 9.2% due to increased tariffs, product investments, and incentive compensation, highlighting the cost pressures impacting profitability.
- Adjusted EPS Decline: Carter's adjusted EPS fell by 20.5% to $1.90, reflecting significant pressure on profitability in a high-cost environment, which exacerbated market pessimism regarding future earnings expectations.
- Future Guidance Below Expectations: The company guided for mid-single-digit net sales growth in Q1, but EPS guidance of $0.02 to $0.08 is well below the consensus of $0.36, leading to a 12.3% drop in shares during premarket trading.
Carters Inc. Reports Increased Q4 Earnings
- Earnings Growth: Carters Inc. reported a fourth-quarter profit of $64.22 million, translating to $1.76 per share, which is an increase from last year's $61.52 million and $1.71 per share, indicating sustained improvement in profitability.
- Adjusted Earnings: Excluding items, the company reported adjusted earnings of $69.2 million or $1.90 per share, reflecting strong performance in its core business and enhanced profitability.
- Revenue Increase: The company's revenue rose 7.6% year-over-year to $925.45 million, up from $859.71 million last year, demonstrating increased market demand and effective sales strategies.
- Market Impact: The growth in earnings and revenue not only boosts investor confidence but also lays the groundwork for future business expansion and market share enhancement, strengthening Carters Inc.'s competitive position in the children's apparel market.
Carter's Q4 Earnings Beat Estimates but Disappointing Outlook
- Earnings Beat: Carter's reported adjusted EPS of $1.90 for Q4, surpassing analyst expectations of $1.56, yet shares fell 5.3% due to disappointing fiscal 2026 guidance.
- Significant Revenue Growth: The company achieved $925 million in revenue for the quarter, an 8% increase from $860 million year-over-year, exceeding the consensus estimate of $903.84 million, with an extra week contributing approximately $37 million in sales.
- Disappointing Outlook: Carter's projects a low double-digit to mid-teens decline in adjusted diluted EPS for fiscal 2026 from $3.47 in fiscal 2025, with Q1 EPS expected to be only $0.02 to $0.08, significantly below last year's $0.66.
- Dividend Declaration: The Board declared a quarterly dividend of $0.25 per share, payable on March 27, 2026, while still aiming for low single-digit to mid-single-digit growth in net sales and adjusted operating income despite tariff cost pressures.
Market Sentiment Shifts to Fear Zone
- Market Sentiment Decline: The CNN Money Fear & Greed Index fell from 45.8 to 44.4, indicating a shift to the fear zone, which may weaken investor confidence and negatively impact stock performance.
- Jobless Claims Rise: Initial jobless claims in the U.S. increased by 4,000 to 212,000, close to the market estimate of 215,000, reflecting potential softness in the labor market that could adversely affect consumer spending.
- Major Index Performance: The Dow Jones rose by about 17 points to 49,499.20, while the S&P 500 fell 0.54% to 6,908.86, and the Nasdaq Composite dipped 1.18% to 22,878.38, indicating overall market pressure.
- Sector Performance Divergence: While most sectors closed lower, with consumer discretionary, information technology, and communication services suffering the largest losses, industrials and financial stocks bucked the trend, suggesting some resilience within the market.